What Percent of Participants Withdrew from Training?
WIOA training services allow for policymakers to expend a significant amount of funds for Training on Title I Adult and Dislocated Worker participants. Such trainings are designed to provide both classroom-based learning and work-based learning. However, not all participants successfully complete these training opportunities. This guide provides a comprehensive approach to analyzing participant withdrawal rates from benchmarking by location, by occupation trained, and by Eligible Training Provider. You will learn how to navigate withdrawal rates, customize the data view to your interest, and look for outliers within the data.
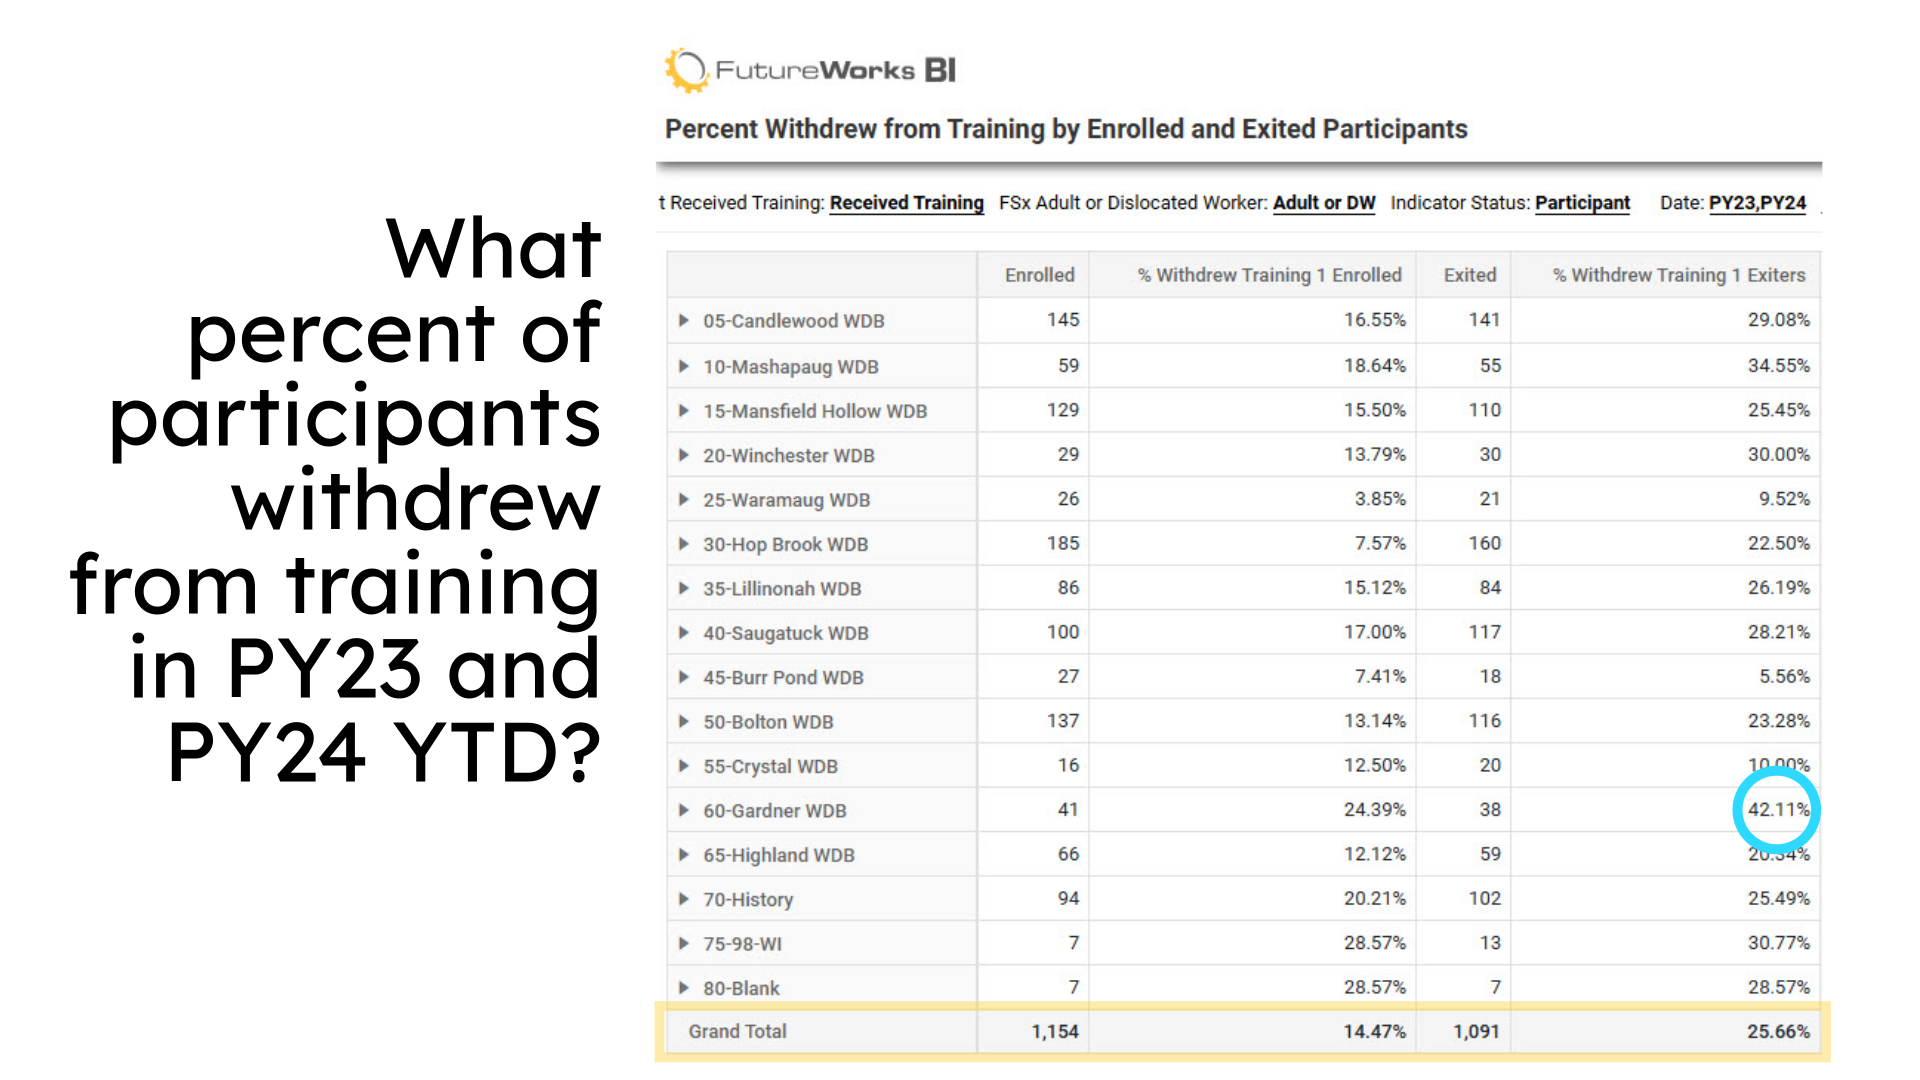
1. What percent of participants withdrew from training in PY23 and PY24 YTD?
In this sample featured view, you can quickly identify the count of participants who Enrolled and received training as well as the count of Exited participants who received training in Program Year 23 and Program Year 24 Year to Date. Of each set of participants, you can then identify the percent of those who withdrew from training all by location. The grand total row is the total count and total percentage of those who withdrew from training. When looking at your data, how closely is your location above or below the grand total? Perhaps consider a variance of 10% or greater. Look for outliers, such as 42.11% of Exiters withdrew from training in workforce board 60- Gardner WDB. The next question may be, "Are participants withdrawing from a single location within the board or are the participants spread among multiple American Job Centers?"
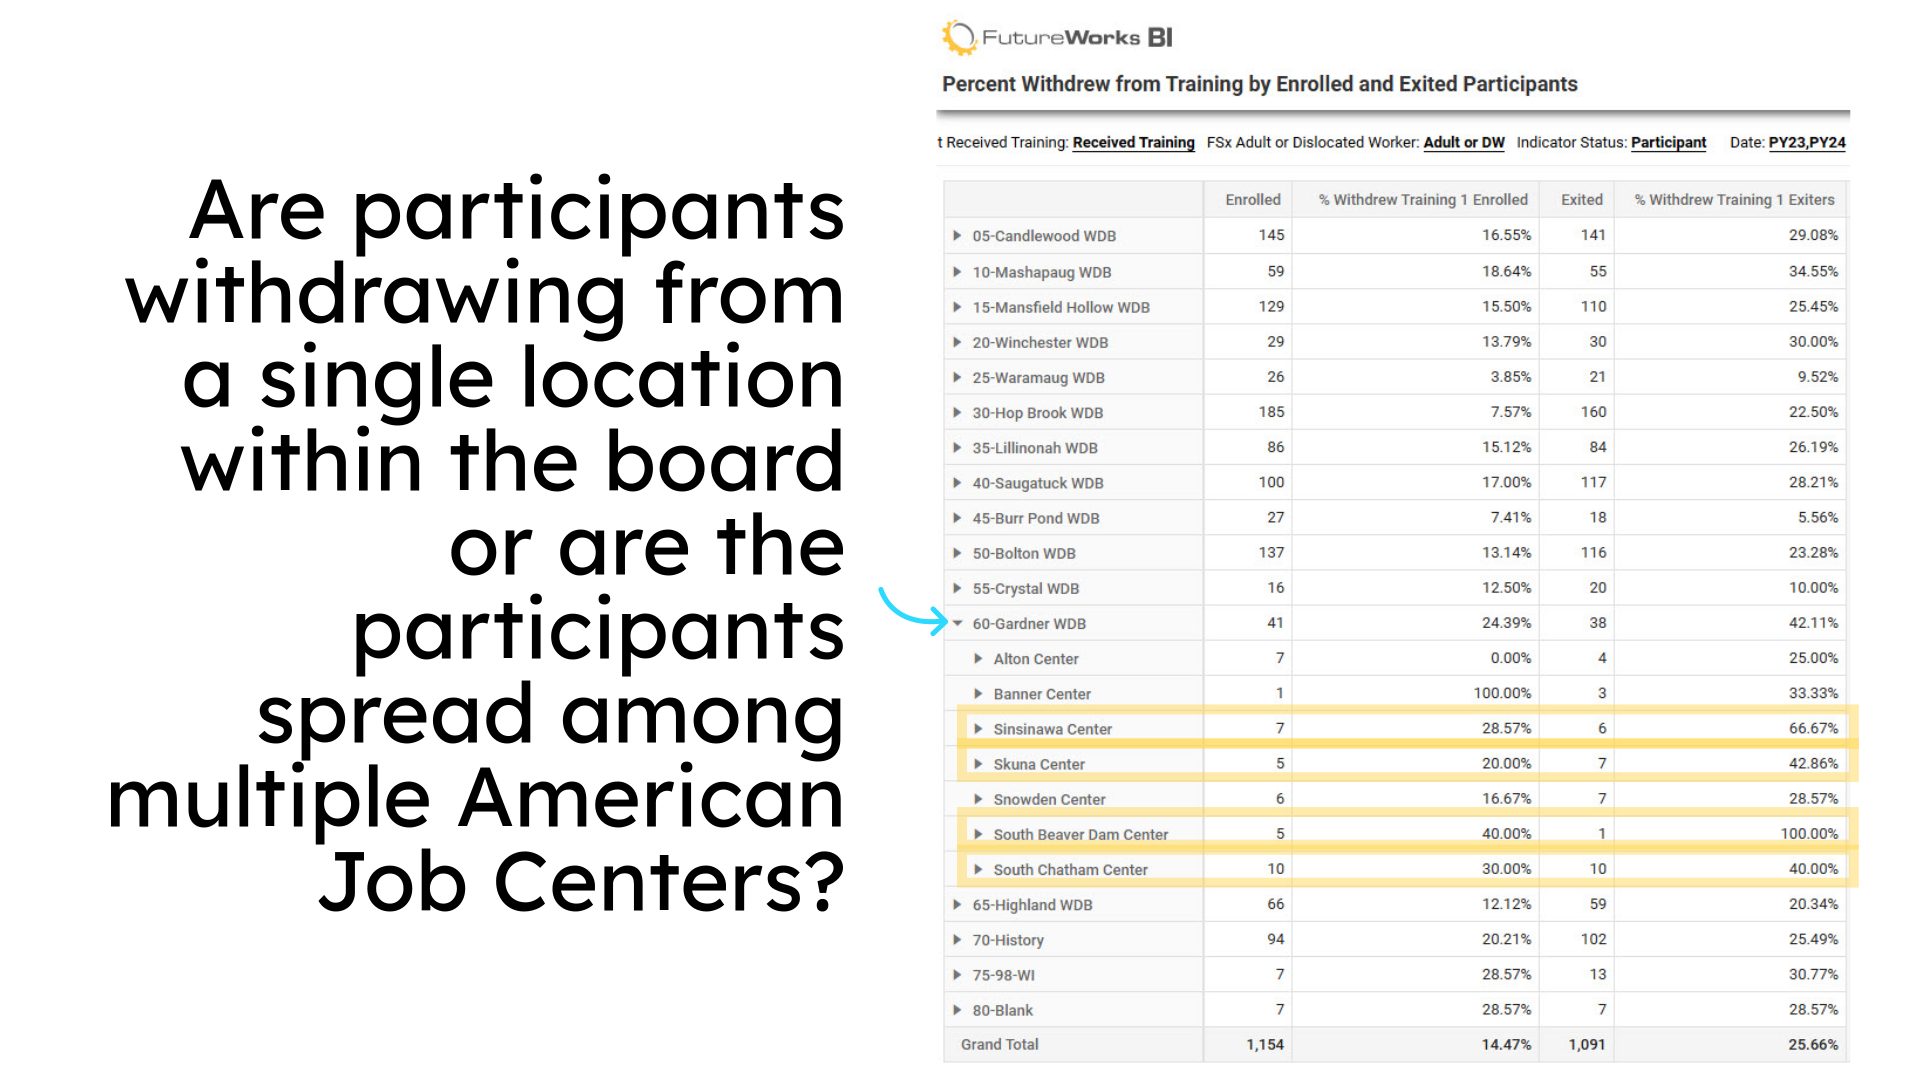
2. Are participants withdrawing from a single location within the board or are the participants spread among multiple American Job Centers?
To take stock of participants either withdrawing from a single location within a board or spread among multiple American Job Centers, expand the locations by clicking the arrow next to the WDB. In the case of 60- Gardner WDB, four locations cause concern about Enrolled and Exited participants withdrawing from training. Each is well above 10% of the grand total. Further analysis could be made. For example, What are the characteristics of the participants who withdraw? Are the participants going to work in lieu of the training? Could the occupations in which participants are being trained play a role in the withdrawal rate?
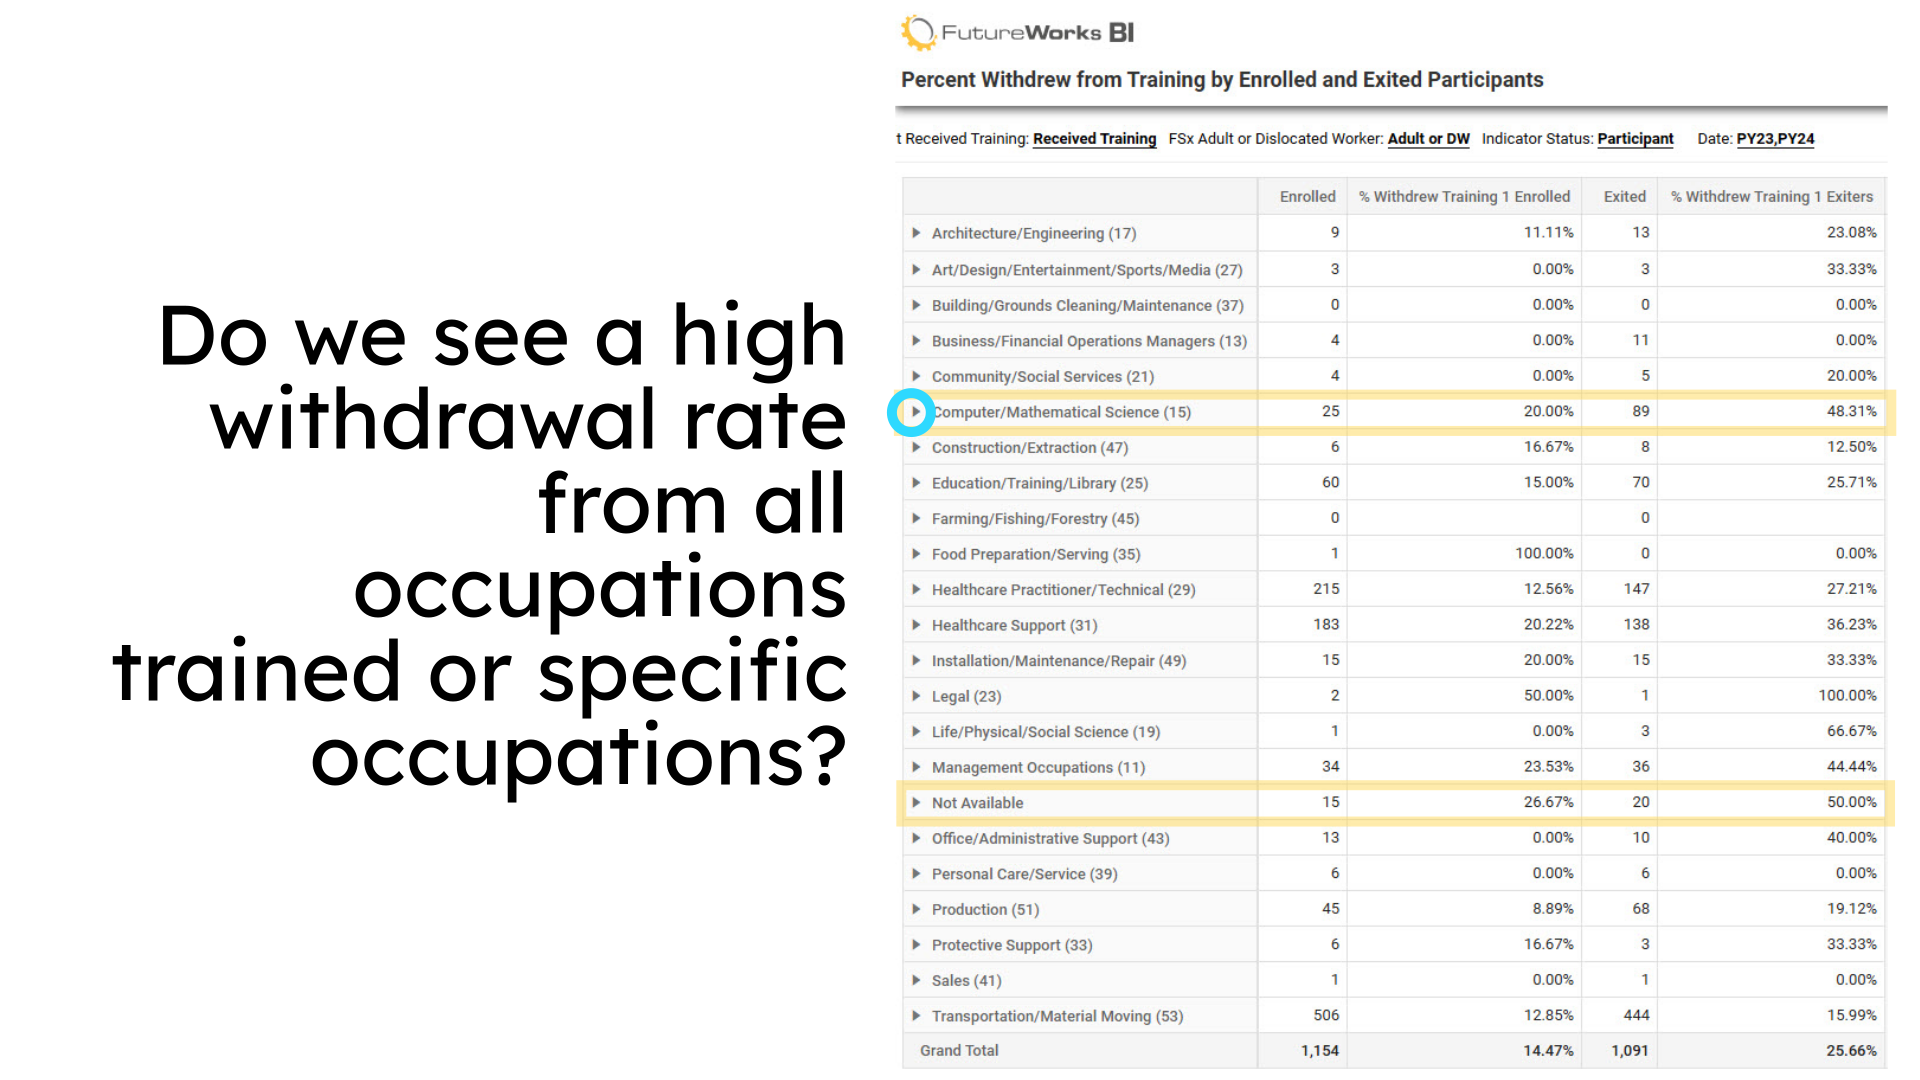
3. Do we see a high withdrawal rate from all occupations trained or specific occupations?
Let's concentrate on the occupations in which participants are being trained. Using this sample data view, you learn that a high percentage of Adults and Dislocated Workers are withdrawing from Computer/Mathematical Science. You can expand the ONET job family to see the next level of the ONET code, which provides the specific occupation being trained. To do so, click the arrow next to the ONET job family name. The data view also highlights a large number of participants who are Enrolled and Exited but do not have an ONET code provided at all. As a result, we are unable to identify the occupation code or codes of these participants with high withdrawals. Consider using this data view to gauge withdrawal rates for your demand occupations. What adjustments may be needed to ensure participants remain in demand occupation training through successful completion?
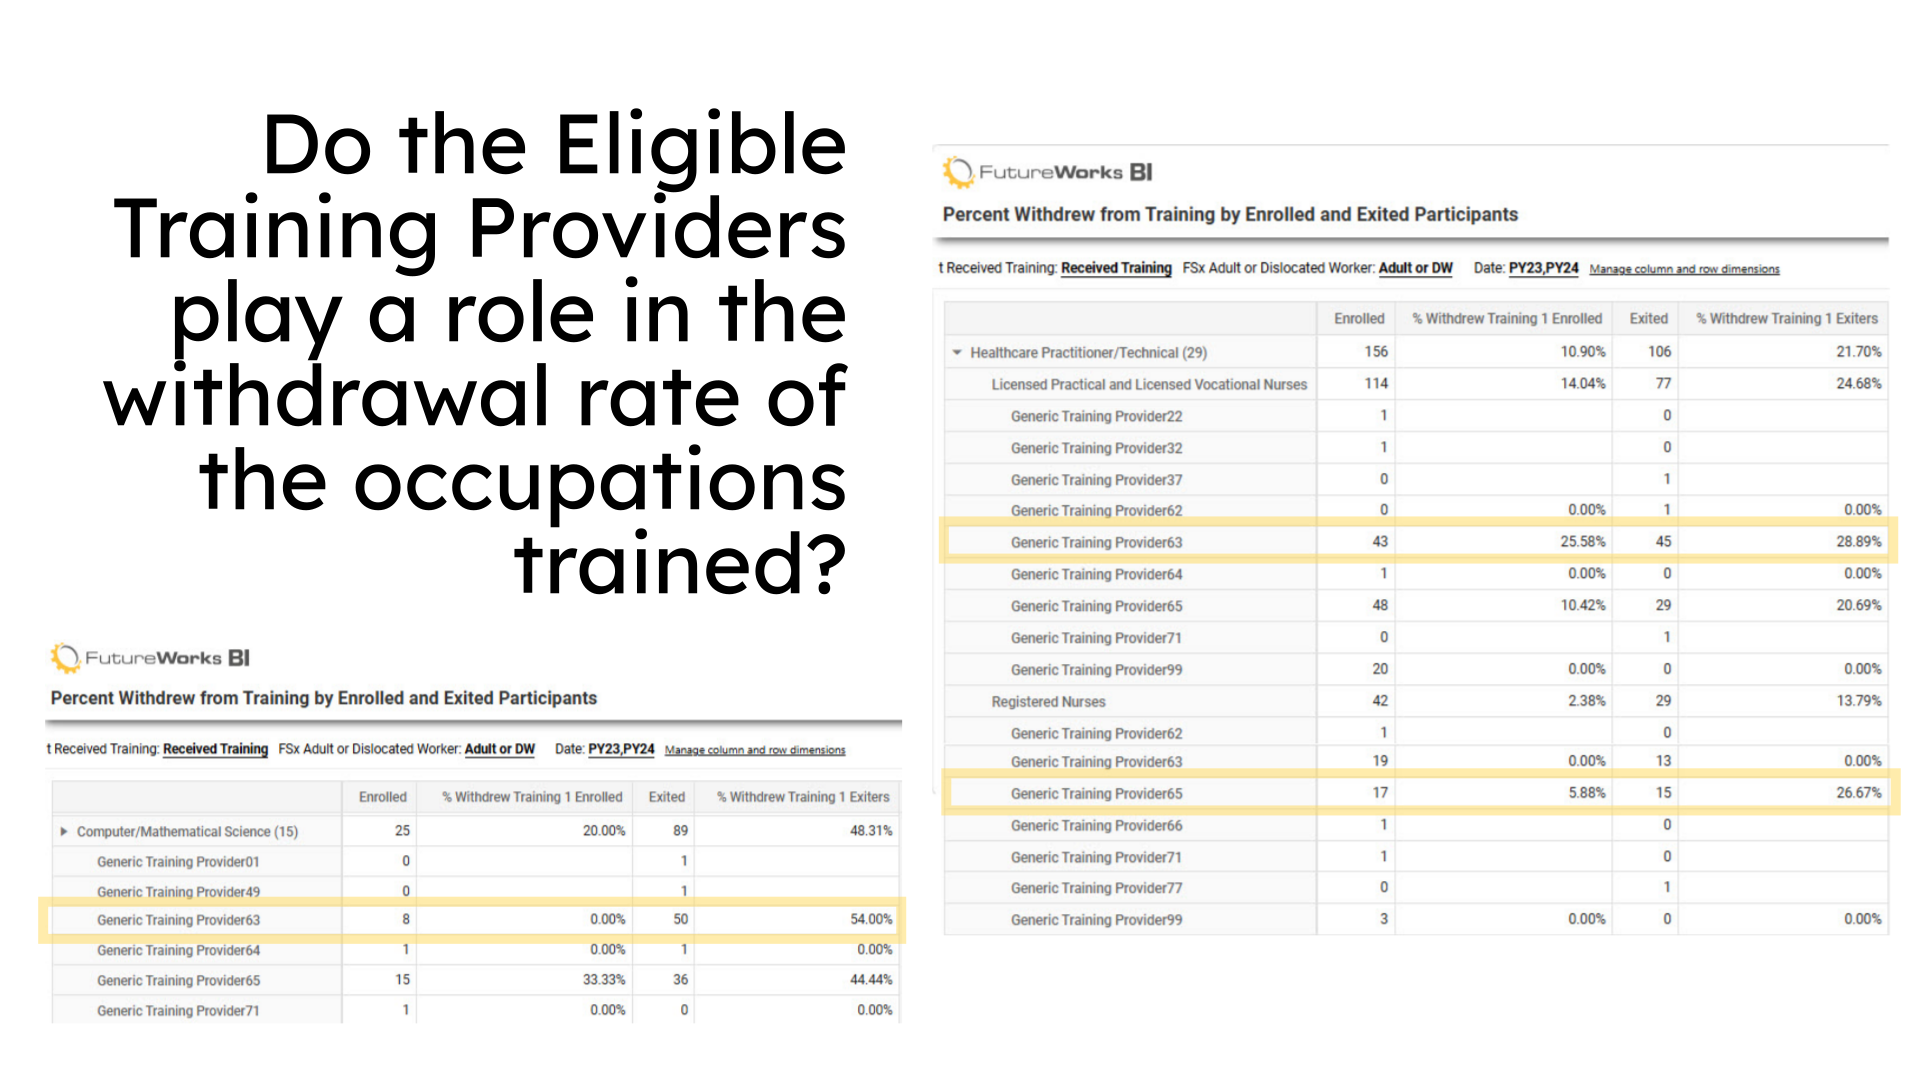
4. Do the Eligible Training Providers play a role in the withdrawal rate of the occupations trained?
Finally, let's explore the role that an Eligible Training Provider may play in the withdrawal rate. We previously saw that there is a high withdrawal rate within the Computer/Mathematical Science ONET code. One provider in particular has over a 50% withdrawal rate, meaning over half of those exited withdrew from training. Looking at the demand occupations of LPNs and RNs, we see two providers with high withdrawal rates. We can also identify providers with many Enrolled and Exited participants with little to no withdrawals. This could be telling when participants are considering training providers.
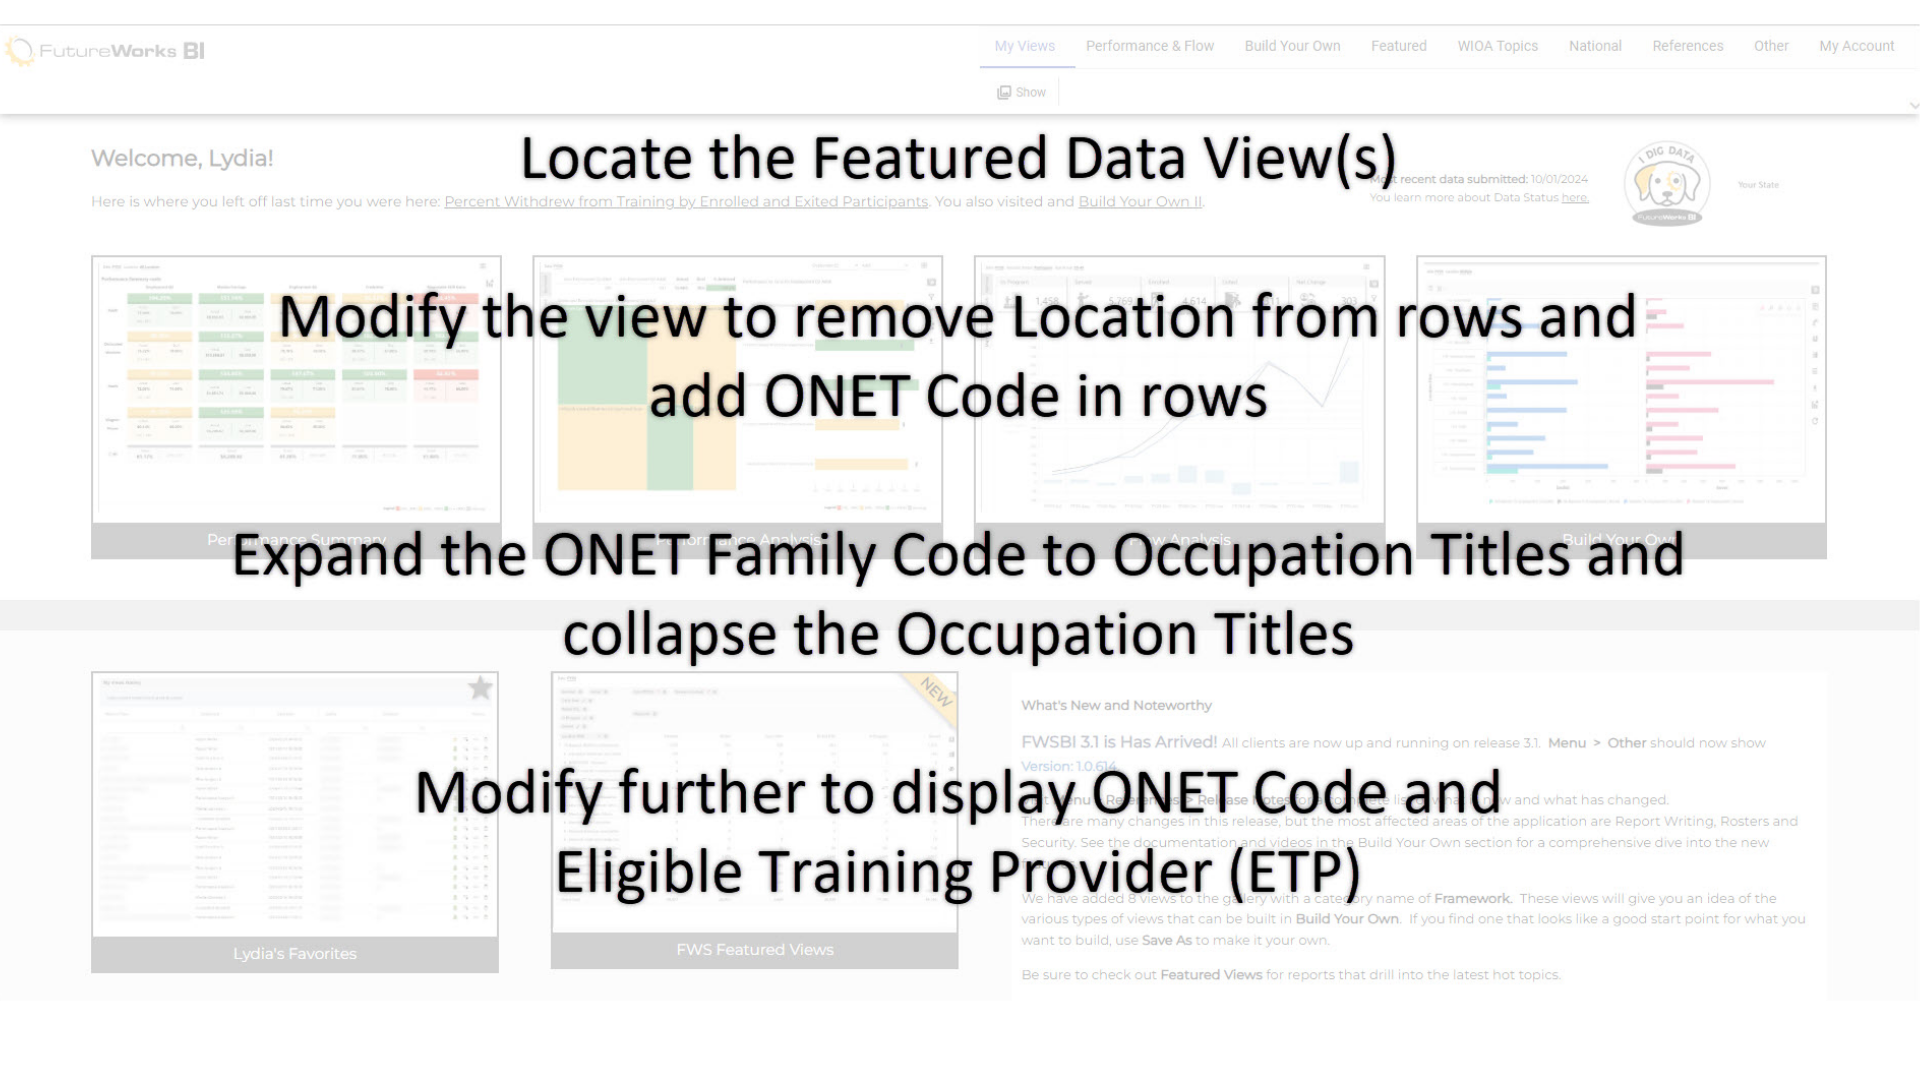
5. Modification Lists for Upcoming Video Clip
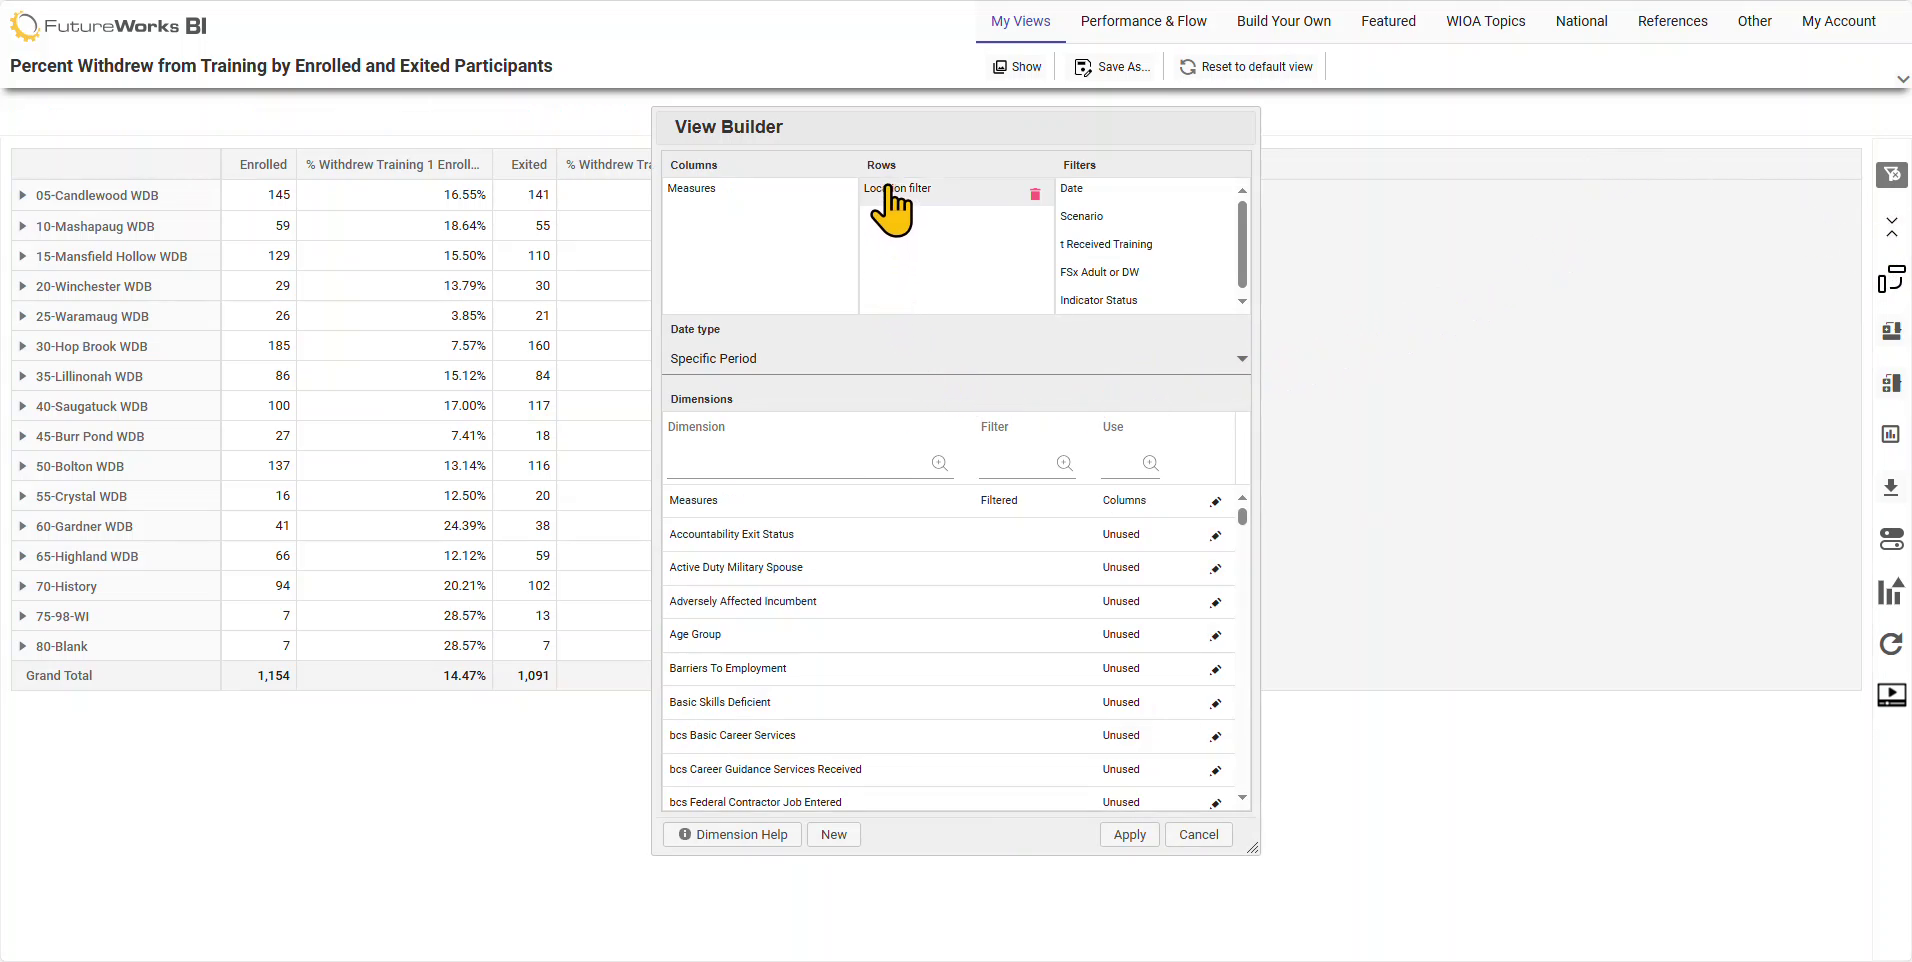
In the upcoming video clip, you will see where the featured view(s) are located and the steps to modify the Featured Data View as highlighted in this guide. The video will display the original view where we see Locations in the rows. Location will be removed and modified to show ONET family codes in the rows, then expanded to the occupation title. Finally, the view will be modified further to display the ONET Code with Eligible Training Providers. Feel free to pause, rewind, and fast-forward the video as needed as there is no voiceover for the video.
6. Modify Withdrawal Rate Video Clip
This Featured Data View examined participant withdrawal rates, including a look by location, occupations trained, and Eligible Training Provider. Using this data view will allow you to gain valuable insights that can aid in improving training retention strategies. Access this data view from your FutureWorks BI home page by clicking on the FWS Featured Views card and selecting the name "Percent Withdrew from Training by Enrolled and Exited Participants." Should you have any questions on this featured data view and modifications, please reach out to us using Live Chat found in the Refernces of FutureWorks BI or emailing us at support@futureworksystems.com.